Seahorse Analytics
Example Artifacts
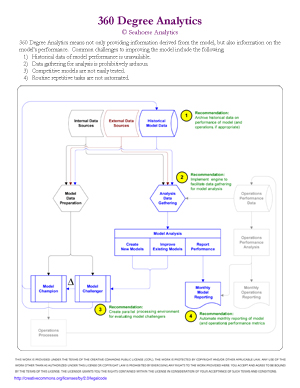
360 Degree Analytics Flowchart
360 Degree Analytics means monitoring model performance in order to improve it. Common difficulties encountered include:
- Historical model data is unavailable.
- Data collection is arduous.
- Competitive models can't be tested.
- Routine tasks are not automated.
Here are the proposed solutions:
- Archive model performance data .
- Streamline model data gathering.
- Build modeling environment.
- Automate performance metrics.
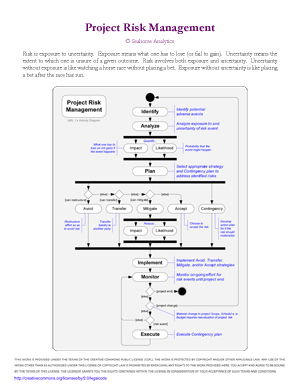
Project Risk Management UML 1.x Activity Diagram
Risk is exposure to uncertainty. Exposure means what one has to lose (or fail to gain). Uncertainty means the extent to which one is unsure of a given outcome. Risk involves both exposure and uncertainty. Project Risk Management means going through the following steps:
- Identify potential adverse events.
- Analyze both the exposure and the uncertainty.
- Develop the risk management plan.
- Implement the risk managment strategies.
- Monitor the project for risks.
- Execute contingency plans, if the risks occur.
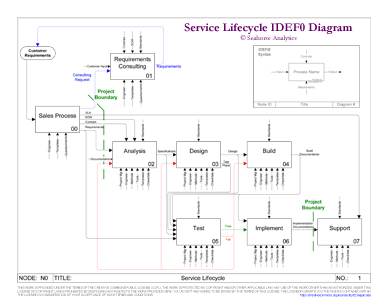
Service Lifecycle IDEF0 Diagram
A "Service Lifecycle" perspective views a company's business activities as progressing through an interrelated series of lifecycle events rather than a series of discrete, unrelated processes. These events may include the following:
- Sales
- Requirmements
- Analysis
- Design
- Build
- Test
- Implementation
- Support
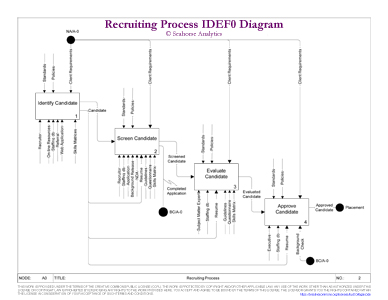
Recruiting Process IDEF0 Diagram
The overall recruiting process involves a series of interrelated sub-processes, each with its own input, output, controls and mechanisms. A simplified example of a process for recruiting a qualified candidate comprises the following processes:
- Identification
- Screening
- Evaluation
- Approval
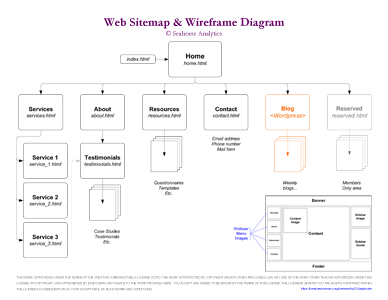
Web Design Sitemap and Wireframe Diagram
This diagram provides a hybrid of a sitemap and a wireframe for the website of a hypothetical services company. A sitemap provides a hierarchical overview of a website, revealing its skeletal structure. Similarly, a wireframe shows the bare bones of an individual page's layout, including such content as text, images, and user interfaces such as menu items, etc.
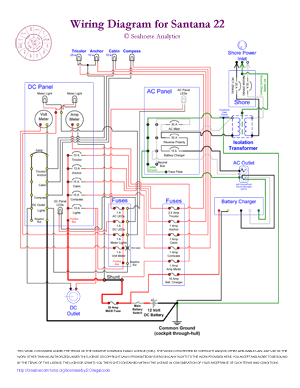
Electrical Wiring Diagram for Santana 22 Sloop
Complex systems may be illustrated with elegance to facilitate understanding. This circuit diagram for a Santana 22 sloop graphically represents a system including both Direct Curent (DC) for powering electrical devices using a battery while under sail, and also Alternating Current (AC) for recharging the battery while at the dock. The use of an isolation trasnformer allows the AC and DC systems to interact without the risk of electrolysis, which could eat away metal through-hulls and possibly sink the boat in the harbor. All the AC electrons "stay on shore", while all the DC electrons "stay on the boat". In this schematic, the depiction of the component connections does not correspond to their actual physical location on the boat.
DISCLAIMER: THIS ELECTRICAL CIRCUIT DIAGRAM IS PROVIDED AS AN EXAMPLE OF ILLUSTRATING A COMPLEX SYSTEM, NOT AS A SUGGESTION FOR OR GUIDE TO DESIGNING OR INSTALLING AN ELECTRICAL SYSTEM. SEAHORSE ANALYTICS DOES NOT ACCEPT ANY LIABILITY FOR LOSS OR DAMAGE INCURRED IN ITS USE.